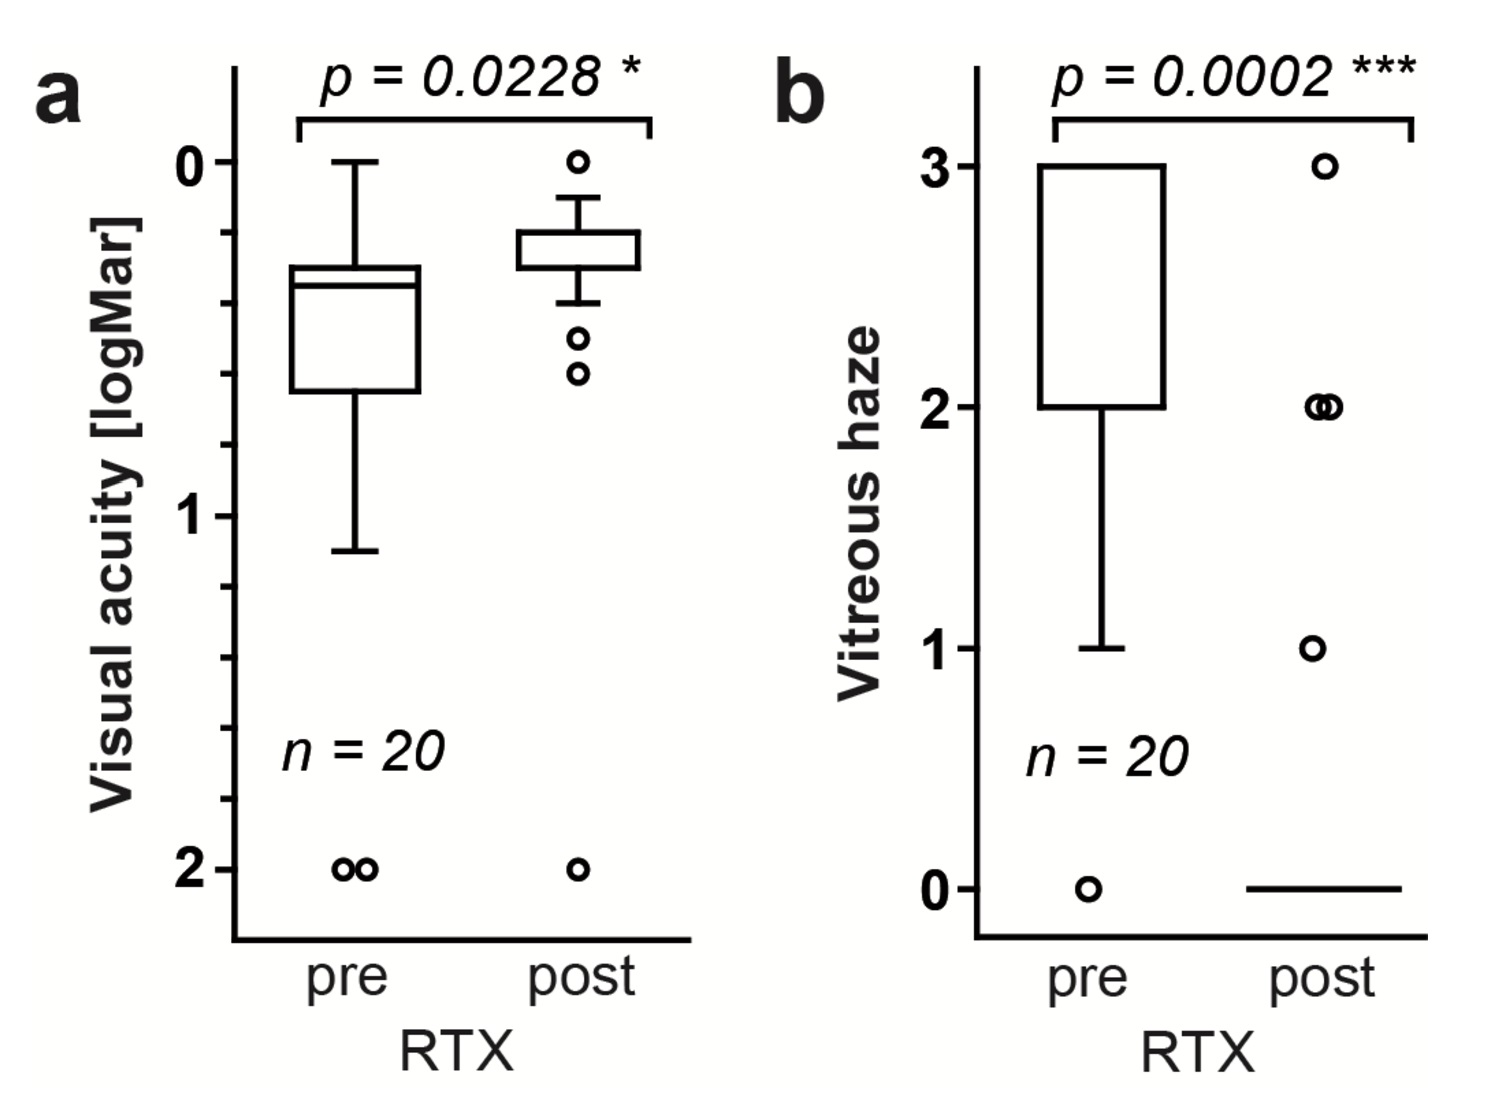
Fig.2 a) Boxplot of logMAR visual acuity before treatment and after treatment, b) Boxplot of vitreous haze score before treatment and after treatment. a) Mean visual acuity before therapy was logMAR 0.57 logMAR with a standard deviation of +/- 0.57 (SEM +/- 0.13). Mean visual acuity after therapy increased to 0.20 logMAR, significant (p=0.02). b) Mean vitreous haze score before therapy was graded +2 with a standard deviation of +/- 0.85 (SEM +/- 0.19). Mean vitreous haze score after therapy decreased to grade 0 with a standard deviation of +/- 0.88 (SEM +/- 0.20), significant (p=0.0002).